
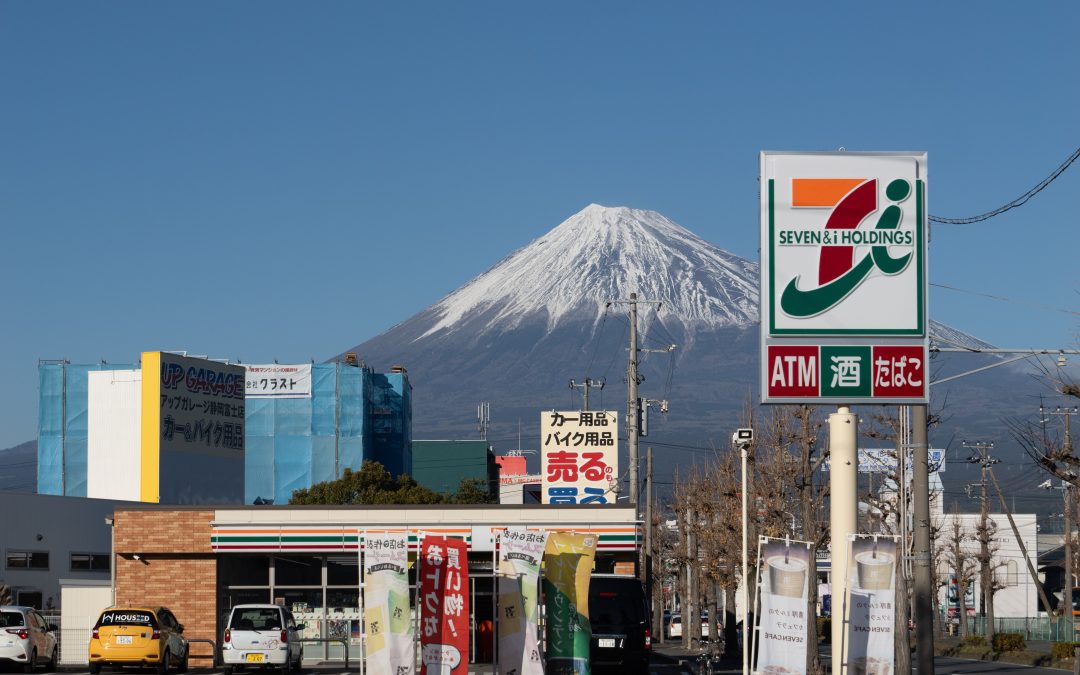
Visit a 7-Eleven in Tokyo, and you’ll see fresh onigiri rotated three times daily, a bank ATM, a dry-cleaning drop-off, concert ticket sales, bill payment options, and a hot food counter that would shame many quick-service restaurants. In contrast, the American equivalent likely offers a hot dog roller, a slushie machine, and a wall of energy drinks. Both are called “convenience stores,” but only one understands what convenience truly means.
For commercial real estate developers, this difference isn’t just an anomaly; it’s a crucial data point related to density, trade area design, and the economics of small-format retail. It should guide how we evaluate sites, select tenants, and envision the future of neighborhood retail centers.
The Konbini, By the Numbers
As of January 2025, Japan has 56,749 convenience stores, or konbini, according to Nippon Software Service. This means approximately one store for every 2,200 residents in a nation of 124 million, with storefronts frequently appearing every few blocks in central Tokyo. The market is dominated by three chains—7-Eleven, FamilyMart, and Lawson—that account for nearly 90% of the network, with 7-Eleven alone operating over 21,500 locations. About 90% of konbini are open 24 hours.
The success of this model is not solely due to store density but also the layering of various functions within a small space. Typical konbini generates substantial revenue from services unrelated to shopping, such as utility bill payments, package pickup and shipping, ATM banking, and ticketing. These stores focus on fresh, frequently rotated prepared meals rather than shelf-stable snacks. This food-centric, service-enhanced format is what Seven & I Holdings, the Japanese parent of 7-Eleven, is now bringing to new markets. The company plans to open around 1,300 new stores in North America by 2030, betting that the konbini model can thrive in U.S. trade areas.
The American C-Store, By the Numbers
The U.S. convenience store sector is massive, with 151,975 stores nationwide, about three times Japan’s total, and projected to generate $817.5 billion in sales by 2025, including $341.2 billion from foodservice and merchandise, according to NACS State of the Industry. Foodservice has become the main growth driver, now representing 28.5% of in-store sales, up from 11.9% in 2005, and contributing 38.9% to gross profit. Prepared foods like pizza, chicken, sandwiches, and wraps account for 73.9% of foodservice sales, compared to 66.4% in 2021. In essence, American operators have already embraced the first part of the Japanese market lesson: focusing on food rather than fuel to maximize margins. However, they have yet to master the second part, offering the service layer and daily-life integration that transforms a konbini into a true third place, rather than just a transaction point en route to elsewhere.
Ownership structure offers part of the story. NACS data reveals that 63% of U.S. convenience stores, totaling 95,672 locations, are operated by businesses with 10 or fewer sites. This results in a fragmented landscape, making it challenging to fund and standardize consistent, capital-intensive service programs. In contrast, Japan’s market is dominated by three major chains that have the scale to develop shared logistics networks, enabling them to restock prepared food multiple times daily across thousands of stores. Scale, beyond mere ambition, is crucial to making the konbini’s service layer economically sustainable.
What’s Actually Being Perfected
Three key differences set the konbini model apart from its American counterpart, all of which influence site selection and tenant mix choices:
1. Trade area density versus store size. Konbini thrives on high visit frequency, which depends on stores being within easy walking distance of dense residential and office areas. In contrast, U.S. convenience store site selection has traditionally focused on vehicle traffic and curb cuts, a carryover from the fuel-centered model that continues to influence where operators open stores.
2. Food quality as the core, not an afterthought. Japanese chains treat prepared food like a quick-service restaurant (QSR), with dedicated supply chains, multiple daily deliveries, and continuous SKU updates. U.S. operators are increasingly adopting this approach, as evidenced by the rise in foodservice sales from 11.9% to 28.5% over twenty years, though execution often lags behind the intent, especially outside flagship locations.
3. Services that turn the store into a destination beyond just purchases. Bill pay, banking, shipping, and ticketing create reasons to visit a konbini even on days when no purchase is made. Few U.S. convenience stores have developed comparable service offerings, resulting in visits that are more transactional than habitual.
Why This Matters for Site Selection and Underwriting
For developers and investors involved in retail and QSR real estate across the western U.S., the konbini data supports an evolving thesis: proximity and frequency of visits are more important than square footage. A small-format tenant with a robust food offering and daily-use appeal can outperform a larger space on the same NNN terms, provided the trade area has sufficient rooftop density to encourage repeat visits.
This also highlights where the next wave of convenience retail demand will emerge. As 7-Eleven’s parent company introduces the konbini model into North America, locations that can support a food-focused, service-oriented small format, walkable density, high daily traffic, and complementary co-tenancy are well positioned to benefit from a format shift already indicated by the data.
For institutional investors analyzing net lease convenience stores and QSR products, the key point isn’t that Japan’s model can be directly copied onto a U.S. pad site. Fuel still plays a crucial role in American convenience store economics, unlike in Tokyo, and drive-centric trade areas will continue to influence site planning for years. However, the trend is clear from the data: increasing foodservice and prepared food shares, with the largest operator actively developing the exact format this data indicates. Developers recognizing this trend today, focusing on density, strong food programs, and service capabilities rather than just raw traffic, will be better positioned for a shift that the industry’s own figures already highlight as ongoing.